When comparing Microsoft Fabric and Power BI, many businesses have a question in mind: Which one do we actually need?
Power BI has become a popular tool for business analytics, dashboards, and reporting. Microsoft Fabric covers a much broader data and analytics environment. You may use both together; however, they aren’t the same.
The Fabric vs. Power BI comparison goes beyond features. It looks at the areas that can affect your choice, including:
- Purpose and scope
- Architecture and data management
- Reporting and analytics
- Licensing and capacity
- Business use cases
- Scalability and governance
In this blog, we’ll discuss these differences in detail and understand when Power BI, Fabric, or both may make more sense for your business.
| Microsoft Fabric and Power BI serve different roles within the data and analytics space. Fabric is a more comprehensive data environment for data management and data analysis. Power BI is mainly a BI tool that’s used for reporting and visualization. They have different scope, features, design, and applications. It is important to understand these differences in order to select the proper approach. |
Microsoft Fabric vs Power BI: What Each Platform Actually Does
What Is Microsoft Fabric?
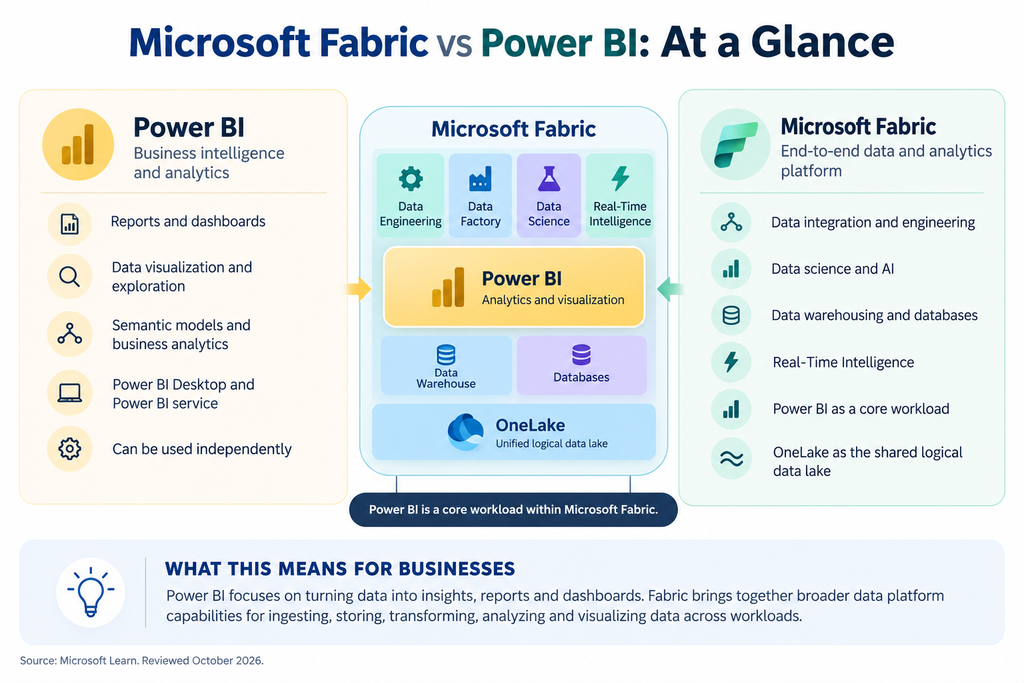
Microsoft Fabric is designed for enterprises that need to conduct a variety of data and analytics tasks within the same environment as business reporting. They can leverage it throughout the data lifecycle, from data preparation to advanced analytics.
Its capabilities include:
- Data integration and engineering
- Data warehousing and databases
- Data science and AI
- Real-time intelligence
- Business intelligence with Power BI
This makes Fabric great for teams using data of any kind in an organization, such as data engineers, analysts, and data scientists.
What Is Power BI?
Business users are able to understand the facts and make decisions in Power BI. It can access data sources, leverage semantic models, and convert data into interactive reports and dashboards.
It is commonly used for:
- Business reporting and performance tracking
- Data visualization and exploration
- Interactive dashboards
- Self-service analytics
Power BI is a viable option for companies that mainly focus on analytics and reporting. This is because Power BI can be used independently.
How Do Fabric and Power BI Work Together?
Power BI is likewise a core workload in Microsoft Fabric. This ensures that businesses can utilize the reporting capabilities in Power BI, while other teams leverage the broader data & analytics capabilities of Fabric.
It’s not necessarily either/or. This can start with Power BI and expand to Fabric with evolving requirements. Other enterprises may use both from the start; however, this completely depends on their data environment and objectives.
Fabric vs Power BI: How the Architecture Differs
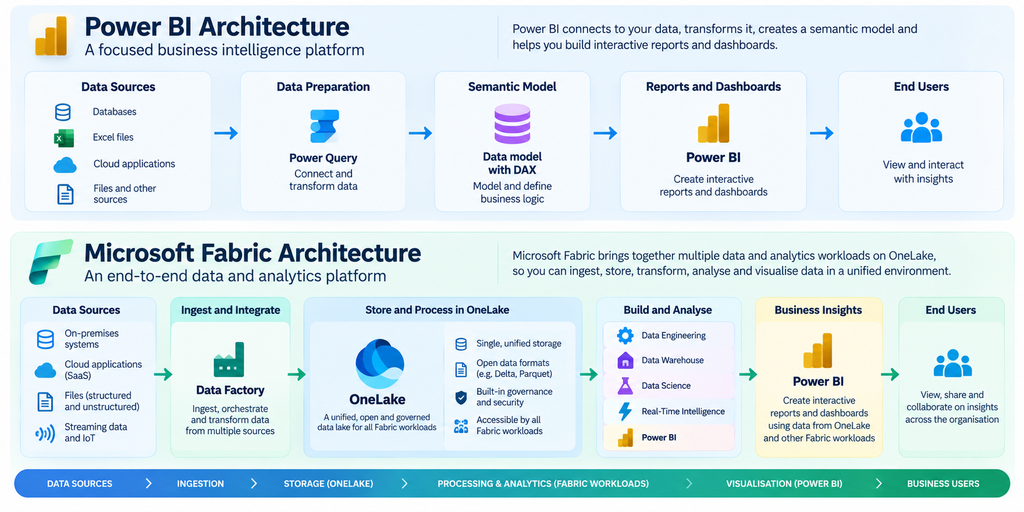
The two most notable differences in architecture are the amount of data movement each platform supports and handles. Power BI can stand on top of the existing data sources and concentrate on the data preparation, modeling, and data presentation. Fabric extends that journey across a wider data environment.
Power BI Architecture
A typical Power BI architecture follows a relatively focused path:
Data sources → Power Query → Semantic model → Reports and dashboards
Power Query helps connect to and transform data before it is modeled for analysis. Finally, the structure that is provided by the semantic model is used for producing reports, dashboards, and visualizations. This fits the needs when a business has its own existing analytics needs and mostly requires a robust analytics layer.
Microsoft Fabric Architecture
The Microsoft Fabric architecture connects more stages of the data journey within one environment. Data can flow into, through, and out of analysis, and into and through reporting.
A typical Fabric environment can bring together:
- Data ingestion and integration
- Data engineering and transformation
- OneLake storage
- Data warehousing
- Data science
- Real-time intelligence
- Power BI reporting
These capabilities operate within the same Fabric environment and can share data across workloads.
OneLake: The Foundation of Fabric’s Architecture
OneLake provides the shared logical data layer underneath Fabric. It gives different Fabric workloads access to organizational data without requiring separate storage for every workload.
This does not mean every data source must be physically moved into OneLake. Supported external data can be referred to as shortcuts, and other cases can be ingestion/replication.
Power BI, therefore, is usually related to the analytics journey, and Fabric can tie a much wider data journey from ingestion to reporting.
End-to-End Architecture
I
Data Management and Storage: OneLake, Data Sources and Data Workloads
Administering Data differs in Power BI and Microsoft Fabric. Reporting is a means to underscore the difference when you separate the facts for a moment. Power BI is point-to-point and separate in getting the information ready for analysis and creating factual models. Fabric supports a wider range of data tasks across connected workloads.
Power BI’s Approach to Data Preparation and Modeling
Power Query is used to connect to numerous data sources and clean the data to be analyzed in Power BI. Users can preprocess, reshape, merge, and modify data prior to the creation of semantic models.
Common steps include:
- Connecting to databases, files, and online services
- Cleaning and transforming source data
- Combining data from multiple sources
- Creating relationships and business calculations
- Preparing data for reporting and analysis
This works well if the primary objective is to use source data and create useful business insights.
Fabric’s Approach to Data Across Workloads
Fabric takes a broader approach to managing data. Data can be prepared for different purposes across the platform.
For example, teams can use:
- Data engineering for large-scale data preparation
- Data warehousing for structured business data
- Data science for advanced analysis
- Real-time intelligence for continuously changing data
- Power BI for business reporting
This enables various groups to operate on related data in a shared larger context.
OneLake and Data Accessibility
OneLake acts as the shared data layer across Fabric. It can be used for either storing or referencing supported external locations. Shortcuts allow access without copying the data itself.
| Area | Power BI | Microsoft Fabric |
|---|---|---|
| Data connection | Connects to many data sources | Connects and integrates data across workloads |
| Transformation | Power Query | Dataflows, notebooks, pipelines, and other tools |
| Storage | Semantic model storage | OneLake and workload-specific storage |
| Processing | Primarily analytics and modeling | Engineering, warehousing, science, real-time, and BI |
| Data access | Mainly supports reporting and analysis | Enables broader cross-workload access |
Important Note: Fabric encompasses a larger data context than Power BI, while Power BI is an application specifically geared towards analyzing data.
Power BI Remains the Business Intelligence Layer
Power BI is considered to be the main analytics and reporting tool in Microsoft Fabric. There’s not a single change forced across the core experience by the addition of Fabric. Teams can still:
- Build interactive reports
- Explore business data visually
- Create and use semantic models
- Share insights with decision-makers
This doesn’t stop Fabric from being considered an extension of the analytics environment; it is not a replacement for Power BI.
From Isolated Reporting to Connected Analytics
The bigger change happens behind the reports. Power BI can work with data prepared through other Fabric capabilities.
For example, data may pass through:
Data engineering → Data warehousing → Data preparation → Power BI analytics
This ensures seamless connections between raw data and business insights. Various teams might contribute to the data environment at various points without creating wholly distinct environments.
What Power BI Users Gain from the Fabric Environment
For existing Power BI users, the main benefit is greater access to data capabilities around their reporting work.
Microsoft Fabric can help teams:
- Bring more data processes into one environment
- Connect reporting with broader analytics workflows
- Support more complex data requirements
- Give analysts access to better-prepared data
This distinction is crucial in Fabric vs Power BI Premium. Probably, Power BI is the analytics layer, and Fabric can be used as the broader environment for it.
Direct Lake vs Import vs DirectQuery: How Data Connectivity Differs
There are various options to connect to data with Power BI, and depending on your data reporting requirements, you will choose the appropriate one. Import, DirectQuery, and Direct Lake each handle data differently.
Import Mode
Import loads a copy of the data into the Power BI semantic model. Typically, it’s fast and creates a report from in-memory data. But source changes are seen after the model’s refresh.
Best suited for:
- Fast dashboards and reports
- Stable reporting requirements
- Scenarios where scheduled refresh is acceptable
DirectQuery
DirectQuery keeps the data in its source system. Power BI sends queries to the report’s source when a person interacts with the report. This can give fresh results, but it takes into account the performance that is to be depended on from the underlining answer.
Direct Lake
Direct Lake is designed for Power BI semantic models using Fabric data stored in OneLake. Rather than loading the required columns into memory from a static, imported copy, it loads the required columns from the Delta table into memory as they are needed. It’s useful when it comes to large datasets and when data is often updated.
Which Connectivity Approach Fits Which Scenario?
| Mode | Data Approach | Best Fit |
|---|---|---|
| Import | Copies data into the model | Fast, scheduled reporting |
| DirectQuery | Queries the source directly | Fresh source data |
| Direct Lake | Reads Fabric data from OneLake | Large, frequently updated data |
For Fabric vs Power BI, Direct Lake is the option most closely tied to the Fabric environment. Import and DirectQuery remain important Power BI choices.
Fabric vs Power BI Licensing: Pro, Premium Per User and Fabric Capacity
The comparison between Fabric vs Power BI can get confusing with licensing. The difference is that there may be a choice between the licensing of individual users, organizational capacity, or both. This is up to the user’s preferences and the type of workloads they run.
Power BI Pro
Power BI Pro is a per-user license for Power BI users to create, publish, share, and collaborate in Power BI. It can be a good option if teams primarily use Power BI, but do not require complex Fabric workloads.
It supports users who need to:
- Create and publish Power BI content
- Share reports and dashboards
- Collaborate with other Power BI users
- Distribute content within the organization
Power BI Premium Per User (PPU)
PPU is also a per-user license. It has all of the Pro capabilities and many of the Power BI Premium capabilities. It can work for smaller teams that require more complex Power BI capabilities but don’t want to purchase those organizational capabilities.
However, PPU cannot be the equal of Fabric capacity. A PPU license is not sufficient to create and run non-Power BI Fabric resources like lakehouse, warehouse, or notebooks.
Fabric Capacity
Fabric capacity is the pool of computing resources that are shared among organizational computing resources. Supports Power BI, along with other Fabric workloads.
This becomes relevant when you need:
- Data engineering and warehousing
- Data science and real-time workloads
- Dedicated computing resources
- Broader Power BI distribution at scale
The exact capabilities and limits depend on the Fabric capacity SKU.
What Happened to Power BI Premium Per Capacity?
Microsoft is retiring Power BI Premium per-capacity P SKUs. Existing subscriptions continue until their current agreement terms end. Microsoft is moving customers toward Fabric capacity F SKUs instead.
Key Takeaway: Microsoft Fabric vs Power BI Premium isn’t simply about licensing. Some thought needs to be given to your users, workloads, scale, and whether you need anything else beyond ‘Fabric’ in Power BI.
Fabric vs Power BI: Which Business Scenarios Fit Each Platform?
The appropriate solution for your business will depend on your data environment’s needs. Some teams may need only strong reporting and analytics. Others might require a more expansive level, permitting data activities from ingestion of raw data to analysis.
Scenario 1: Power BI Is Enough
If your company already has a solid database or data house and you require the ideal visuals, then Power BI might be the thing you’re in search of. The next step is to translate that information into valuable insights.
It can be a good fit when you mainly need:
- Reporting and interactive dashboards
- Semantic models and business metrics
- Self-service analytics for business teams
Scenario 2: Multiple Disconnected Data Sources
As your data environment requirements vary, so will the solution that best fits your business. For some teams, formidable reporting and analytics are all they need. Others might require a more expansive platform with broader data work capabilities from ingestion to analysis.
Fabric can help bring these data processes into a more connected environment.
Scenario 3: Broader Data Engineering Requirements
Data teams can do more than just reporting needs, and Power BI might not be able to address all requirements. Fabric becomes more relevant when an organization needs several data capabilities together.
This can include:
- Data ingestion and transformation
- Data engineering and warehousing
- Data science
- Business intelligence
Scenario 4: Real-Time or Near-Real-Time Analytics
For businesses that require more agility in responding to evolving data, scheduled reports might not be sufficient. These can be things like customer activities, monitoring operations, or any other event that’s continually changing.
Power BI can coexist with Fabric to enable more use cases of real-time analytics.
Scenario 5: Enterprise-Wide Analytics Platform
In a large organization, there could be multiple teams operating with data in various ways for different purposes. They could require a common platform to enable analytics within a consistent governance and access framework.
If you need a wider range of services, Fabric may be a better fit.
Scenario 6: Hybrid Adoption
You do not always need to choose between Fabric and Power BI. A business may already have a well-established Power BI environment and add Fabric capabilities as new requirements emerge.
This approach can allow teams to expand their data capabilities without replacing existing Power BI reporting.
Scalability, Performance, and Real-Time Analytics
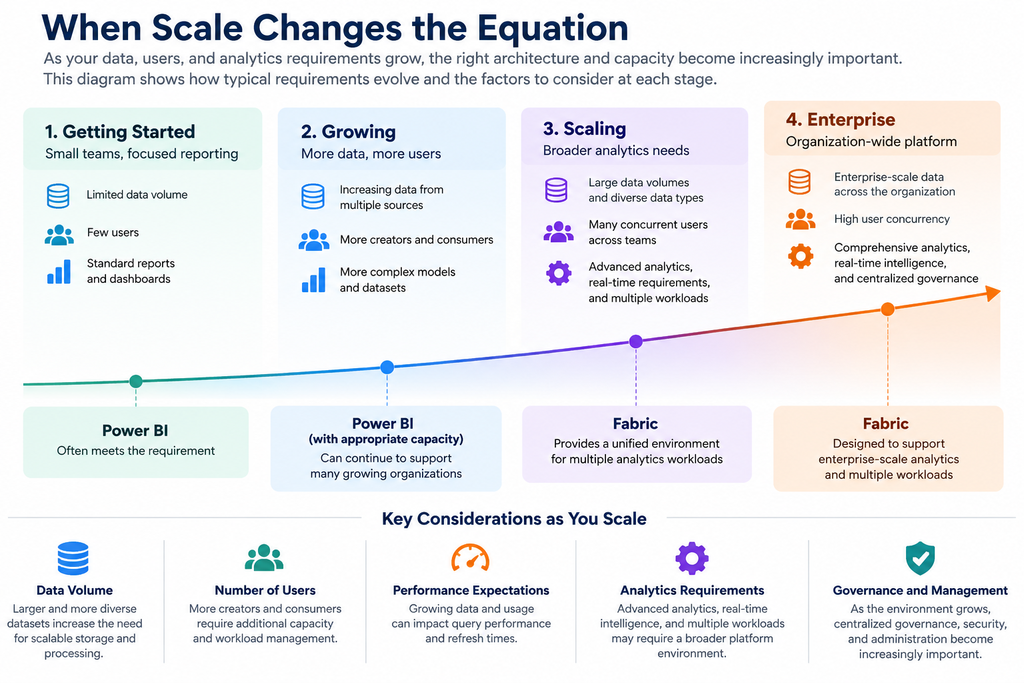
As data and user numbers grow, performance can become harder to manage. More data, more queries, and more frequent refreshes can put greater pressure on the environment. Performance depends on more than the platform itself. Data models, query design, source systems, workload, capacity, and implementation all matter.
For larger environments, businesses may need to consider:
- Growing data volumes and analytical workloads
- More concurrent users and queries
- Refresh frequency and performance expectations
- Capacity utilization and workload management
- Separating demanding workloads when needed
Fabric capacity can support multiple workloads, but those workloads can compete for shared compute. Organizations may scale capacity or separate workloads when performance requirements increase.
What Does Real-Time Actually Mean?
Not every business needs real-time analytics. It helps to distinguish between three common approaches:
- Scheduled or batch reporting: Data updates at defined intervals.
- Frequently refreshed analytics: Data refreshes often to provide more current insights.
- Real-time or streaming analytics: Data is processed as events arrive, with minimal delay.
Power BI supports frequent refresh and real-time scenarios, while Fabric also provides dedicated capabilities for streaming and real-time intelligence.
The key is to match the architecture and capacity to the actual business need. Bigger data alone does not automatically mean Fabric is the better choice.
I
Data Governance, Security, and Administration
Good data governance becomes more important as more people and teams work with business data. Power BI provides governance controls for reports, semantic models, access, sharing, and compliance. Microsoft Fabric extends these controls across a broader data estate.
Key areas include:
- Security and access: Control users, roles, permissions, and data access.
- Lineage and discovery: Track relationships between data assets and understand downstream impact.
- Compliance: Apply sensitivity labels, auditing, and data protection policies.
- Administration: Manage users, workspaces, capacities, settings, and organizational policies.
- Microsoft Purview: Extend governance, classification, protection, and lineage across the data estate.
| Area | Power BI | Microsoft Fiber |
|---|---|---|
| Governance scope | BI content | Broader data estate |
| Security | User and content access | Broader access controls |
| Lineage | BI asset relationships | Cross-Fabric asset lineage |
| Administration | BI administration | Tenant, workspace, and capacity administration |
| Compliance | Labels, auditing, protection | Broader governance with Purview |
In short, Power BI governance can meet focused BI needs. Fabric security and administration become more important as data environments grow.
What Does Fabric Mean for Existing Power BI Users?
If your organization already uses Power BI, adopting Fabric does not mean starting over. Your existing reports, dashboards, semantic models, and familiar Power BI workflows can continue to support everyday analytics.
Fabric can add broader capabilities around that existing environment, especially when data requirements become more complex.
Depending on your needs, you can gradually introduce:
- Data engineering and broader data management
- Data science and advanced analytics
- Real-time data capabilities
- Additional Fabric workloads
A phased approach can make adoption easier. Instead of changing everything at once, teams can add capabilities where they solve a clear business need.
Before expanding, it is worth reviewing:
- Current architecture and dependencies
- Capacity and performance requirements
- Security and governance
- Team skills and readiness
This approach lets organizations build on their existing Power BI investment while introducing Fabric at a practical pace. It also avoids treating Fabric as an all-or-nothing decision.
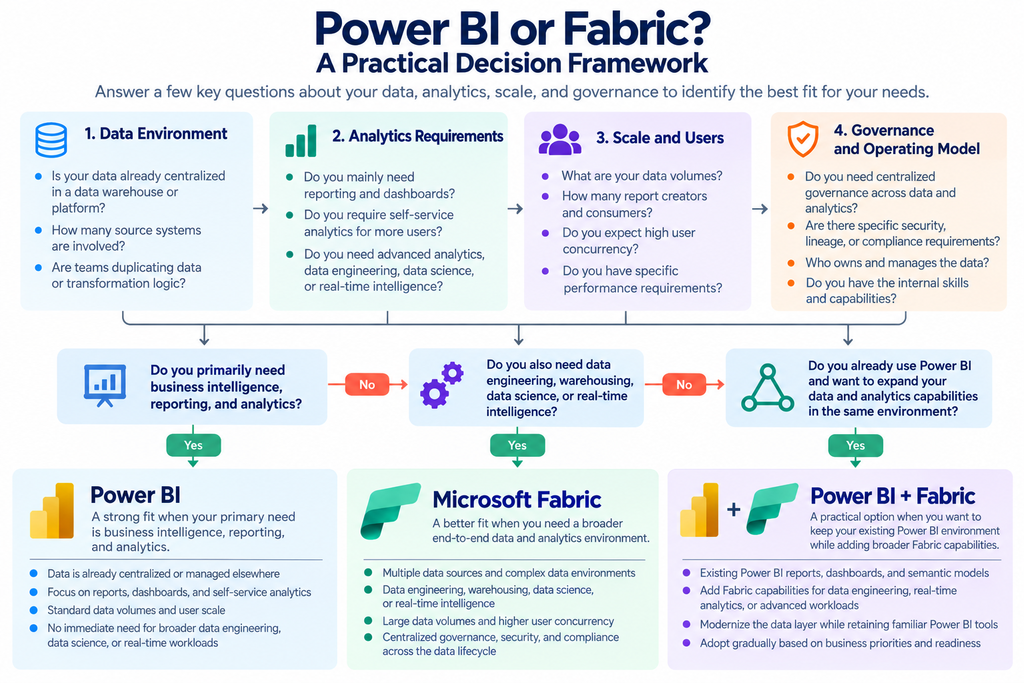
Power BI or Fabric? A Practical Decision Framework
Choosing between Power BI and Microsoft Fabric is easier when you start with your actual business needs. There is no single option that works for every organization. The right choice depends on how your data environment looks today and where it needs to go.
Before deciding, consider these questions:
- Data environment: How many sources do you manage? How complex is your data?
- Analytics needs: Do you mainly need reporting, or also advanced analytics, engineering, or real-time intelligence?
- Scale: How much data do you handle? How many users and concurrent queries do you expect?
- Governance: What level of security, lineage, compliance, and administration do you need?
- Existing investments: Can your current Power BI environment support future requirements?
Your answers can point toward one of three practical paths:
- Power BI: A strong fit when business intelligence, reporting, and analytics are the main priorities.
- Microsoft Fabric: Better suited to broader data and analytics needs across multiple workloads.
- Power BI + Fabric: A practical option when you already rely on Power BI but need broader data capabilities.
The goal is not to choose the bigger platform by default. It is to choose an approach that fits your current needs and gives you room to grow.
Conclusion
The Fabric vs Power BI decision is less about picking a winner and more about finding the right fit. Power BI can meet reporting and analytics needs, while Microsoft Fabric suits broader data requirements. Your data environment, scale, governance needs, and existing investments should guide the choice.
For some businesses, Power BI remains the right option. Others may benefit from Fabric, while some can use both together. The best approach is one that supports current priorities without limiting future growth. Need help choosing the right path for your organization? Talk to a DynaSum IT Expert.
Frequently Asked Questions
1. Can Microsoft Fabric be used without Power BI?
Yes. Microsoft Fabric includes Power BI as one of its workloads, but it also supports data engineering, data warehousing, data science, and real-time intelligence. Teams can use these capabilities without making Power BI the primary reporting tool. This makes Fabric useful for organizations with broader data requirements.
2. How does Microsoft Fabric support development, testing, and production workflows?
Fabric supports development workflows through Git integration and deployment pipelines. Teams can connect supported Fabric items to a Git repository, track changes, and manage versions. Deployment pipelines can then move supported content through development, test, and production environments. This helps teams make controlled changes without treating every update as a manual process.
3. What role does Dataflow Gen2 play in Microsoft Fabric?
Dataflow Gen2 helps teams connect, clean, transform, and move data using a visual interface. It can work with databases, files, web services, and other sources. Transformed data can then be loaded into destinations such as Fabric Lakehouse or Azure SQL for further use.
4. Does Microsoft Fabric replace Azure Data Factory?
Not automatically. Fabric Data Factory is the next generation of Azure Data Factory, but the two services have different capabilities and roadmaps. Organizations using Azure Data Factory should review connectors, activities, integration requirements, and migration considerations before making a change.
5. Does adopting Microsoft Fabric mean replacing existing data platforms?
No. Fabric can work with existing data platforms through capabilities such as OneLake shortcuts and mirroring. Data can remain at its source in some scenarios, while Fabric provides access through a unified data layer. This allows organizations to introduce Fabric without automatically replacing every existing system.